Home Blog Page 585

The Companies That Support Linux and Open Source: Hart

Hart is a medical software technology company that improves the ways in which people inside and outside of the industry access and engage with health data.

Founded in 2012, the startup develops HartOS, an API platform that allows healthcare providers and their vendors and partners to use health data from multiple computer systems in a HIPAA-compliant manner in a range of digital formats. These may include medical records, hospital information, radiology information, laboratory information, picture archiving, emergency department, and other systems.

Last month, Hart became a Gold member of The Linux Foundation. Here, Hart Founder Mo Alkady tells us more about his company; how open source is contributing to changes in the healthcare industry; and how they participate in the open source community.

Linux.com: How and why do you use Linux and open source?

Mo Alkady: Utilizing the Linux kernel is crucial to our servers running CentOS. It’s a no-brainer; the open source community has helped tipped the scales as giants continue to open up licensing under Apache, in order to help and maintain their own ecosystems.

Linux.com: Why did you increase your commitment to The Linux Foundation?

Mo Alkady: In an ever changing world, contributions and support of the open source community are more crucial than ever to help expedite the developments we make as a technological society.

Linux.com: What interesting or innovative trends in the healthcare industry are you witnessing and what role do Linux and open source play in them?  

Mo Alkady: The electronic medical record is crucial to the advancement of healthcare around the world, and we are starting to see the healthcare industry look to specific solutions in the technology sector, looking to adopt newer standards by vendors; if we can work to build an open source standard, this enables and further lowers the barriers of entry for those to help advance the medical space.

Linux.com: How is your company participating in that innovation?

Mo Alkady: We joined as a contributing body to the Open API initiative. For us, we believe building the proper frameworks to enable others to share data is the key for vast improvements of the technical variety to be pushed forward in healthcare.

Linux.com: How has participating in the Linux and open source communities changed your company?

Mo Alkady: The open source community is key to our culture; our values involve ingenuity, craftsmanship and change.

Growing Up Node: Lessons for Successful Platform Migration

Switching from one technology to another is always going to be hard, and, despite the popularity of Node.js, it does come with its own set of complexities, and the advantages are not always apparent to management, says Trevor Livingston, principal architect at HomeAway, speaking at Node.js Interactive.

Livingston’s previous work at Paypal gives him a unique insight into how to introduce Node into companies. PayPal started out using C++ and later Java, before introducing Node. Livingston was recruited to help introduce Node and was the Node Platform Lead at PayPal, while at the same time part of the KrakenJS team. Toward the end of his tenure at PayPal, the company employed 800 Node developers, maintained 100 applications, and 1500 internal modules. The Node framework served over 400 million requests per day. All in all, quite a successful move.

But how do you get there? Livingston admits there is no magic recipe. At PayPal, the team learned as they went and counted on a lot of help, not only from a receptive management but also from the Node community. Livingston recommends leveraging the community, noting that problems you encounter have probably been encountered by others before you.

Apart from support, you are going to need a plan. The first thing you have to take into account is that re-platforming comes at a cost no matter what. Figuring out if the benefits outweigh that cost — that is, finding the true reason you are shifting to Node — is crucial to get started on the right foot. Livingston says it is fundamental to understand what kind of problems you are setting out to solve. It could be you want to increase productivity, allowing your developers to iterate faster; or you may be looking to scale more cheaply. Understanding the problem and aligning your goals to those of the business not only helps you plan better but also makes it easier to explain the aim of the migration to those financing the project.

Once you have a plan, Livingston recommends demonstrating success. Even small successes, such as a single application that improves the overall user experience, can help pave the way for the rest of the platform shift. Using what Livingston describes as “Build. Measure. Learn.” approach, when you deploy a small application, you need to monitor how it works, including users into the process, and draw conclusions to improve the application in the next iteration.

Livingston also warns against several anti-patterns — the first of which is entering the “Migration” mindset. Thinking in terms of “how to translate a Java class into a JavaScript class,” for example, is the wrong way to go about things, because you end up with Java, or C, or what have you, but just written with a JavaScript syntax. Instead, Livingston suggests “creating isolation and building new,” by breaking down tasks into small pieces and implementing each piece from the ground up using the new platform.

The next challenge is moving your project from one team to all the teams. Being consistent, says Livingston, will help with that. Despite being a fan of “wild west” development, Livingston says constraints are necessary to create reproducible success. The consistency will come from the design choices you make, making your project more configuration-based, using pre-existing frameworks. Another important factor is education. You need to ensure that engineers are trained from the outset and then mentor them. Engagement is the third element to bring teams together. To encourage engagement, Livingston recommends developing in the open, sharing code, landmarks and successes with other teams.

Beware Turn-Key Solutions

The anti-pattern to the above is turn-key solutions. There will be the temptation of wrapping everything up in a box and tying everybody to that. Doing so, however, traps you in an ecosystem that stifles innovation. Being consistent is about capabilities, not rails, says Livingston. Capabilities allow teams to move to new technologies as they become available — not so if you are married to rigid framework.

Moving along from development to deployment, when the code is put into production, when people start using what has been built, things start to get really interesting. How do you account for performance problems or Node crashing? The first thing to look at is security. Security is the number one concern for a business, so it should be the number one concern for the developers. As npm is pretty open as to what modules get uploaded to the service, you should take into account security advisories. There are several tools for this, such as nsp and Snyk.

Performance is another area of concern. To monitor performance of your application in the real world, Livingston recommends becoming familiar with APM (application performance management) tools, such as New Relic and AppDynamics, and incorporating performance monitoring as a matter of course when testing.

The final “sticky problem” Livingston mentions is availability. Node, for all intents and purposes, is single process, and when you have uncaught exceptions, the process crashes. When the process crashes while handling a request, it will hang for the user and the state of the program becomes unknown. This requires you becomes familiar with how frameworks handle errors. However, in Livingston’s experience, 99 percent of all crashes are caused by developers ignoring errors in callbacks.

The anti-pattern here is being single-minded about your approach. Unfortunately, Node is not a silver bullet that will solve all your developmental and deployment problems, and Livingston suggests a holistic approach to problem solving.

Down the line, the decisions you make today regarding design choices are going to affect you tomorrow. Livingston warns against using pure dependencies, for example, because it makes migration much harder in the future. You must also be wary of globals. He also advises against making assumptions about your upstream. If you have something like an Express middleware, and you have expectations on the upstreams, you no longer have decoupled software. As for Local Continuation Storage, for Livingston, this is definitely a no-no. He describes it as “magic” of the blackest kind.

Moving on from design choices, Livingston recommends considering ownership carefully. You must think of who is going to maintain each piece of code in the future. The same goes for support: you should focus on self-sufficiency. That said, the anti-pattern for this is hand holding, because people learn through failing. It is a good idea to establish early on that it is okay to fail and that failure is valuable educational tool.

One last thing that can help you succeed in moving your platform over to Node is being transparent with management, especially with regard to inner source. Inner source is the concept of sharing code across teams and contributing code that other teams’ can use.

Management may not understand why a developer is not on the task they have been assigned 100 percent of the time. However, a developer may be improving the productivity of another team in a substantial way, and other teams may help in turn the developer’s original team with their own issues. The idea is that a certain degree of inner source can help improve the productivity across the board. This concept, which is obvious in open source circles, must often be explained to the management.

For more details, watch the complete presentation below:

https://www.youtube.com/watch?v=m4Wpx4Ul5fs?list=PLfMzBWSH11xYaaHMalNKqcEurBH8LstB8

If you’re interested in speaking at or attending Node.js Interactive North America 2017 – happening October 4-6 in Vancouver, Canada – please subscribe to the Node.js community newsletter to keep abreast of dates and deadlines.

Bouncing Back To Private Clouds With OpenStack

There is an adage, not quite yet old, suggesting that compute is free but storage is not. Perhaps a more accurate and, as far as public clouds are concerned, apt adaptation of this saying might be that computing and storage are free, and so are inbound networking within a region, but moving data across regions in a public cloud is brutally expensive, and it is even more costly spanning regions.

So much so that, at a certain scale, it makes sense to build your own datacenter and create your own infrastructure hardware and software stack that mimics the salient characteristics of one of the big public clouds. What that tipping point in scale is really depends on the business and the sophistication of the IT organization that supports it; Intel has suggested it is somewhere around 1,200 to 1,500 nodes. But clearly, just because a public cloud has economies of scale does not mean that it passes all of those benefits on to customers. One need only look as far as the operating profits of Amazon Web Services to see this. No one is suggesting that AWS does not provide value for its services. But in its last quarter, it brought nearly $1 billion to its middle line out of just under $3.5 billion in sales – and that is software-class margins for a business that is very heavily into building datacenter infrastructure.

Some companies, say the folks that run the OpenStack project, are ricocheting back from the public cloud to build their own private cloud analogues, and for economic reasons. 

Read more at The Next Platform

Open Source Project Management Can Be Risky Business

The Linux kernel is the core of all Android devices, and nearly a third of all Internet traffic rides on just one openly developed project, Netflix. (Read the excellent article in Time magazine about this.) How does the choice of using open source software as part of a project plan affect the amount and type of risk to a project within an organization?

Risk is both a perception and a reality. Tools help us move from perception toward reality the same way good thermometers helped us move from very generalized use of the terms hot and cold to more specific quantifiable temperatures (see an example in Google). Over time we’ve adopted different standards and techniques for discussing specific temperatures, which depend on the audience and the standard’s limitations. Kelvin, Celsius, Fahrenheit, and even RealFeel are now established standards for measuring temperature.

Read more at OpenSource.com

Where is the Edge in Edge Computing?

Aside from 5G and the Internet of Things (IoT), the third acronym on everyone’s lips at Mobile World Congress 2017 was MEC, which stands for mobile edge computing. But where exactly is the edge?  The answers are all over the board, but they paint a picture of network architectures, which are getting more generic.

Before the show, speaking with Nurit Sprecher, a principle architect at Nokia who’s heading up the ETSI ISG MEC group, she said, “MEC is about providing cloud computing at the edge of the network, characterized by low latency and high bandwidth. We’re talking about distributed cloud.”

Read more at SDxCentral

Blockchain for Supply Chain: Enormous Potential Down the Road

Blockchain is presently at the peak of Gartner’s Hype Cycle, which means the next stop is the Trough of Disillusionment. In supply chain circles the technology is suddenly drawing serious interest, in part because of IBM’s recent push to go public with pilots including one with Maersk and another with Walmart. It has also begun to feature regularly in conversations I’m having around disruptive technology with C-level supply chain leaders, especially in CPG and retail. It feels a bit like RFID déjà vu.

Reminiscent of RFID, blockchain could one day provide certainty on the exact source of every ingredient in every jar, in every case, on every shelf and at all times. Was your palm oil sustainably sourced? Are the cherries in your ice cream organic? Are the avocados in your salad imported from Mexico? Also reminiscent of RFID, however, is a decent amount of uncertainty about the timing of the business case.

Read more at Forbes

Restrict SSH User Access to Certain Directory Using Chrooted Jail

There are several reasons to restrict a SSH user session to a particular directory, especially on web servers, but the obvious one is a system security. In order to lock SSH users in a certain directory, we can use chroot mechanism.

change root (chroot) in Unix-like systems such as Linux, is a means of separating specific user operations from the rest of the Linux system; changes the apparent root directory for the current running user process and its child process with new root directory called a chrooted jail.

In this tutorial, we’ll show you how to restrict a SSH user access to a given directory in Linux. Note that we’ll run the all the commands as root, use the sudo command if you are logged into server as a normal user.

Read more at Tecmint


ApacheCon: Tomorrow’s Software, Today. Schedule Announced!

The Apache Software Foundation, in conjunction with our friends at The Linux Foundation events team, are proud to announce the schedule for ApacheCon North America – http://events.linuxfoundation.org/events/apachecon-north-america/program/schedule – and Apache Big Data North America – http://events.linuxfoundation.org/events/apache-big-data-north-america/program/schedule

Since 1999, The Apache Software Foundation (ASF) has been recognized as a leading source for Open Source software and tools that meet the demand for interoperable, adaptable, and sustainable solutions.

The all-volunteer ASF develops, stewards, and incubates dozens of enterprise-grade Open Source projects that power mission-critical applications in financial services, aerospace, publishing, government, healthcare, research, infrastructure, and more. From Abdera to ZooKeeper, the ASF’s reliable, community-driven software continues to grow dramatically across many categories, including Cloud, IoT and Edge Computing, Artificial Intelligence and Deep Learning, Mobile, and Big Data, where the Apache Hadoop ecosystem dominates the marketplace.

Today, many of the ASF’s 300+ projects serve as the backbone for some of the world’s most visible and widely used applications in Big Data (Cassandra, Hadoop, Spark); Cloud (CouchDB, CloudStack, Mesos); Search and CMS (Derby, Jackrabbit, Lucene/Solr); DevOps and Build Management (Ant, Buildr, Maven); Web Frameworks (Flex, OFBiz, Struts); Servers (HTTP Web Server, Tomcat, Traffic Server); among others.

Come to ApacheCon to learn about tomorrow’s software, today. Find out what’s coming next out of the Apache Incubator that will change the world again. Meet the people that make it happen, and get in on the ground floor of the next wave of innovation.

ApacheCon North America and ApacheCon Big Data will be held at the Miami Intercontinental, May 16th through 18th, 2017.

Come early for the Apache Traffic Server and Apache Traffic Control Summit. ATS and ATC are the workhorses behind some of the largest websites in the world. The summit will be happening on Sunday, May 14, and May 15, before the main conference. Find out details about this event at http://events.linuxfoundation.org/events/apachecon-north-america/extend-the-experience/ats-summit

And on Monday, May 15, we’ll be holding the BarCampApache event, a full-day, unconference style event, where many of the ideas behind Apache projects have been hatched in the past. Details are at http://events.linuxfoundation.org/events/apachecon-north-america/extend-the-experience/barcamp

Early bird pricing for ApacheCon ends on Sunday, so register today to save $200. Register for ApacheCon North America at http://events.linuxfoundation.org/events/apachecon-north-america/attend/register- or for Apache Big Data at http://events.linuxfoundation.org/events/apache-big-data-north-america/attend/register-  But note that a ticket for the one also gives you full access to the other event. (The Traffic Server Summit is a separate ticket.)

For the latest information about the event, follow us on Twitter, @apachecon. For interviews and past conference talks, see http://feathercast.apache.org/ and follow @feathercast. For news and announcements, subscribe to the apachecon-discussion mailing list by sending a blank message to apachecon-discuss-subscribe@apache.org or, subscribe to the lower-volume ApacheCon Announce list by sending mail to announce-subscribe@apachecon.com

See you in Miami!

This article originally appeared at the Apache Software Foundation.

Linux Foundation Key to Data Center Networking Evolution Says SDxCentral Report

Data centers must continue to evolve to handle the increasing network load generated by our frequent use of applications and services like voice activated network applications (OK Google, Alexa), video, mobile phones, IoT devices, and more, according to SDxCentral’s 2017 Next Gen Data Center Networking Report.

The report predicts that the big web companies like Facebook, Google, Microsoft, and Amazon will spur a lot of the innovation through organizations like The Linux Foundation, who will help drive these open source technologies into the broader ecosystem. Networking vendors will need to innovate and engage beyond the increasingly commoditized hardware platforms and find a balance between differentiating their solutions and collaborating in joint projects that could cannibalize their business.

To better understand why data center evolution is important for enterprises and communication service providers, SDxCentral looks at four key business drivers:

  • Increased competitiveness driving agility, cost-savings, and differentiation in IT
  • Increased consumption of video and media-rich content
  • Dominance of cloud and mobile applications
  • Importance of data — Big Data, IoT, and analytics

The report also looks at trends across several key components in Next Gen Data Center Networking (NGDCN), including:

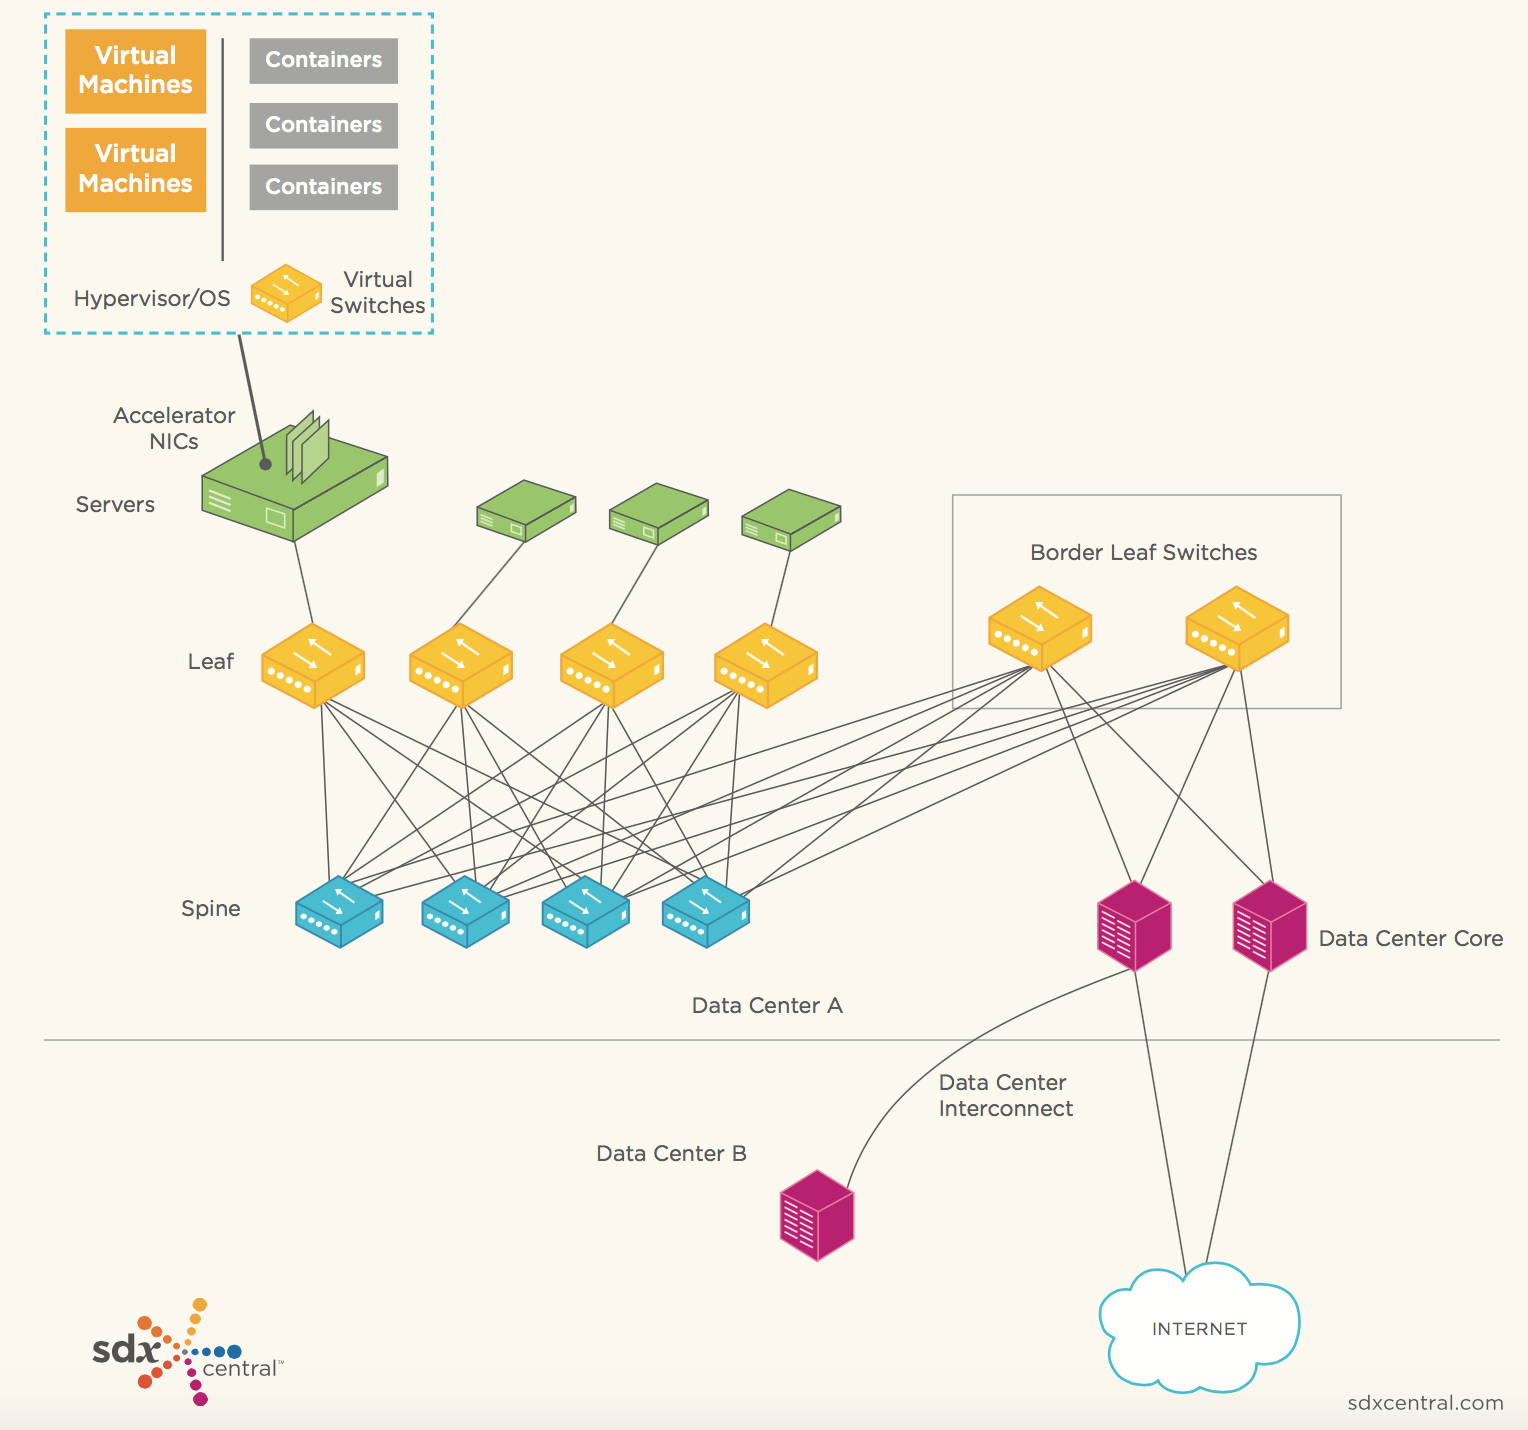
  • Virtual Switch (vSwitch): Maintaining good application performance can be dependent on performance of the vSwitch, and it’s an important part of the stack as the point of entry into the network for applications. The report indicated that “the most common vSwitch we find in most data centers today is Open vSwitch (OVS), a Linux Foundation project.”
  • Accelerator NICs: Accelerator or intelligent network interface cards (NICs) are becoming more popular with data center operators looking to get even better performance by pushing some of the packet processing onto this specialized hardware.
  • ToR, Leaf and Spine: Leaf switches (top-of-rack switches) and spine switches are part of most new network architectures designed for high-throughput connections between data center servers that are being used by the big web companies.
  • Data Center Interconnects (DCI): Connectivity between data centers typically required a separate, dedicated box devoted to DCI, but recent advances are eliminating the need for these dedicated solutions and allowing direct connections.

Next-Generation Data Center Networking
As NGDCN trends evolve, SDxCentral highlights a few important, overarching trends emerging over the past few years:

  • Trend 1: Disaggregation and White box
  • Trend 2: Virtualization, Overlays, and OpenStack
  • Trend 3: Two-stage Leaf-spine Clos-Fabrics with ECMP and Pods
  • Trend 4: SDN, Policy, and Intent
  • Trend 5: Big Data and Analytics

According to the report, “to understand how NGDCN will evolve, it’s important understand two major elements. Firstly, what major projects are underway at the web titans, and secondly, how these projects will migrate to new open-source organizations like Linux Foundation and the OCP (and for some components, the OpenStack Foundation).”

The Linux Foundation is poised to become a key player in NGDCN. “With the importance of open-source across networking and with increased importance of SDN, virtual switches and open software stacks in the NGDCN, the Linux Foundation has become highly relevant to NGDCN evolution. … We anticipate that over the course of 2017 and 2018, we will see significant innovations coming from these and other software projects that have big impacts on the NGDCN,” the report states.

Learn more about the future of networking at the Open Networking Summit April 3-6, with more than 75 sessions led by industry visionaries. Register now >>

Monitoring your Machine with the ELK Stack

This article will describe how to set up a monitoring system for your server using the ELK (Elasticsearch, Logstash and Kibana) Stack. The OS used for this tutorial is an AWS Ubuntu 16.04 AMI, but the same steps can easily be applied to other Linux distros.

There are various daemons that can be used for tracking and monitoring system metrics, such as StatsD or collectd, but the process outlined here uses Metricbeat, a lightweight metric shipper by Elastic, to ship data into Elasticsearch. Once indexed, the data can be then easily analyzed in Kibana.

As it’s name implies, Metricbeat collects a variety of metrics from your server (i.e. operating system and services) and ships them to an output destination of your choice. These destinations can be ELK components such as Elasticsearch or Logstash, or other data processing platforms such as Redis or Kafka.  

Installing the stack

We’ll start by installing the components we’re going to use to construct the logging pipeline — Elasticsearch to store and index the data, Metricbeat to collect and forward the server metrics, and Kibana to analyze them.

Installing Java

First, to set up Elastic Stack 5.x, we need Java 8:

sudo apt-get update
sudo apt-get install default-jre

You can verify using this command:

$ java -version

java version "1.8.0_111"
Java(TM) SE Runtime Environment (build 1.8.0_111-b14)
Java HotSpot(TM) 64-Bit Server VM (build 25.111-b14, mixed mode)

Installing Elasticsearch and Kibana

Next up, we’re going to dDownload and install the public signing key for Elasticsearch:

wget -qO - https://artifacts.elastic.co/GPG-KEY-elasticsearch | sudo apt-key add -

Save the repository definition to ‘/etc/apt/sources.list.d/elastic-5.x.list’:

echo "deb https://artifacts.elastic.co/packages/5.x/apt stable main" | sudo tee -a /etc/apt/sources.list.d/elastic-5.x.list

Update the system, and install Elasticsearch:

sudo apt-get update && sudo apt-get install elasticsearch

Run Elasticsearch using:

s

You can make sure Elasticsearch is running using:

curl localhost:9200

The output should look something like this:

{

 "name" : "OmQl9JZ",

 "cluster_name" : "elasticsearch",

 "cluster_uuid" : "aXA9mmLQS9SPMKWPDJRi3A",

 "version" : {

   "number" : "5.2.2",

   "build_hash" : "f9d9b74",

   "build_date" : "2017-02-24T17:26:45.835Z",

   "build_snapshot" : false,

   "lucene_version" : "6.4.1"

 },

 "tagline" : "You Know, for Search"

}

Next up, we’re going to install Kibana with:

sudo apt-get install kibana

To verify Kibana is connected properly to Elasticsearch, open up the Kibana configuration file at: /etc/kibana/kibana.yml, and make sure you have the following configuration defined:

server.port: 5601

elasticsearch.url: "http://localhost:9200"

And, start Kibana with:

sudo service kibana start

Installing Metricbeat

Our final installation step is installing Metricbeat:

sudo apt-get update && sudo apt-get install metricbeat

Configuring the pipeline

Now that we’ve got all the components in place, it’s time to build the pipeline. Our next step involves configuring Metricbeat — defining what data to collect and where to ship it to.

Open the configuration file at /etc/metricbeat/metricbeat.yml

In the Modules configuration section, you define which system metrics and which service you want to track. Each module collects various metricsets from different services (e.g. Apache, MySQL). These modules, and their corresponding metricsets, need to be defined separately. Take a look at the supported modules here.

By default, Metricbeat is configured to use the system module which collects server metrics, such as CPU and memory usage, network IO stats, and so on.

In my case, I’m going to uncomment some of the metrics commented out in the system module, and add the apache module for tracking my web server.

At the end, the configuration of this section looks as follows:

- module: system

 metricsets:

   - cpu

   - load

   - core

   - diskio

   - filesystem

   - fsstat

   - memory

   - network

   - process

 enabled: true

 period: 10s

 processes: ['.*']

- module: apache
 metricsets: ["status"]
 enabled: true
 period: 1s
 hosts: ["http://127.0.0.1"]

Next, you’ll need to configure the output, or in other words where you’d like to send all the data.

Since I’m using a locally installed Elasticsearch, the default configurations will do me just fine. If you’re using a remotely installed Elasticsearch, make sure you update the IP address and port.

output.elasticsearch:
 hosts: ["localhost:9200"]

If you’d like to output to another destination, that’s fine. You can ship to multiple destinations or comment out the Elasticsearch output configuration to add an alternative output. One such option is Logstash, which can be used to execute additional manipulations on the data and as a buffering layer in front of Elasticsearch.

Once done, start Metricbeat with:

sudo service metricbeat start

One way to verify all is running as expected is to query Elasticsearch for created indices:

curl http://localhost:9200/_cat/indices?v

You should see a list of indices, one being for metricbeat.

Analyzing the data in Kibana

Our last and final step is to understand how to analyze and visualize the data to be able to extract some insight from the logged metrics.

To do this, we first need to define a new index pattern for the Metricbeat data.

In Kibana (http://localhost:5601), open the Management page and define the Metricbeat index in the Index Patterns tab (if this is the first time you’re analyzing data to Kibana, this page will be displayed by default):

iDCsKGGi2WjP2JyF6zS6tpvQ2ZkJ1BFNnbm8H9PR

Select @timestamp as the time-field name and create the new index pattern.

Opening the Discover page, you should see all the Metricbeat data being collected and indexed.

8737wCL_uLsHP4RfNUIL472Xygi8FQNrKbrolGeN

If you recall, we are monitoring two types of metrics: system metrics and Apache metrics. To be able to differentiate the two streams of data, a good place to start is by adding some fields to the logging display area.

Start by adding the ‘metricset.module’ and ‘metricset.name’ fields.

_sawsHLUVRGTnj3a-NHXZ78RX3jRCp3mUPBieUoL

Visualizing the data

Kibana is notorious for its visualization capabilities. As a simple example, let’s create a simple visualization that displays CPU usage over time.

To do this, open the Visualize page and select the area chart visualization type.

We’re going to compare, over time, the user and kernel space. Here is the configuration and the end-result:

XDo-R_duPV2oqI3w8nJwkqBOoNYCLZSpi02rxCln

Another simple example is a look at how our CPU is performing over time. To do this, we will pick the line chart visualization this time and use an average aggregation of the ‘system.process.cpu.total.pct’ field.  

LB8xY5rZ71A8NF6QtN5GP2r8yYBRDkzZtEnmjtDl

Or, you can set up a series of metric visualizations to show single stats on critical system metrics, such as the one below showing the amount of free memory.

uBoYkrG-sj6CTjsoM3r9CaO8pt2pXO5nL8wwlDmY

You’ll need to edit the field in the Management page to have the metric display the correct measuring units.
Once you have a series of these visualizations built up, you can combine them all into a nice monitoring dashboard. Side note – if you’re using the Logz.io ELK Stack, you’ll find a Metricbeat dashboard ELK Apps, a library of free pre-made visualizations and dashboards for different data types.

Summing it up

In just a few steps you can have a good comprehensive picture of how well your system is performing. Starting from memory consumption, through to CPU usage and network packets — ELK is a very useful stack to have pn your side, and Metricbeat is a sueful tool to use if its server metric monitoring you’re after.  

I highly recommend setting up a local dev environment to test this configuration, and compare it with the other metric reporting tools.