Open source software has become the dominant model for how technology infrastructure operates all around the world, impacting organizations of all sizes. Use of open source software leads to better and faster development, and wider collaboration, and open source skills are an ever more valuable form of currency in the job market. In this article series, we’ll take a closer look at one of the best new ways to gain open source fluency: the Introduction to Open Source Software Development, Git and Linux training course from The Linux Foundation.
Some development experience, as well as some command-line experience, are ideal prerequisites for taking the course, but are not required. The course presents a comprehensive learning path focused on development, Linux systems, and Git, the revision control system. The $299 course is self-paced and comes with extensive and easily referenced learning materials. Organizations interested in training more than five people through the course can get a quote on possible discounts here.
This story is the first in a four-part article series that highlights the major aspects of the training course. The course begins with a general introduction to working with open source software, and explores project collaboration, licensing and legal issues. On the topic of collaboration, the curriculum emphasizes that project collaboration offers some distinct advantages over other kinds of developments models:
When progress is shared not everyone has to solve the same problems and make the same mistakes. Thus, progress can be much faster, and costs can be reduced.
Having more eyeballs viewing code and more groups testing it also leads to stronger and more secure code.
It is often hard for competitors to get used to the idea of sharing, and grasping that the benefits can be greater than the costs. But experience has shown this to be true again and again.
Competitors can compete on user-facing interfaces, for example, instead of internal plumbing that everyone needs, so that end users still see plenty of product differentiation and have varying experiences.
The course’s discussion of licensing is comprehensive and explains clearly how some open source licenses are highly restrictive, while others are permissive. The discussion also delves into how differing project needs and philosophies can dictate how permissive or restrictive a license should be. Permissive licenses do not require modifications and enhancements be made generally available, as is noted in the the course materials. Prominent permissive licensing examples include the BSD and Apache licenses.
Before launching into some of the Linux- and Git-specific curriculum, the course presents other guidance that is important to observe when working with open source projects The downstream impact of leadership and control decisions is one of these topics. “If the controllers of a project take and do not give back by mentoring and moderating they are limiting what a project can accomplish,” the course materials state. “A good leader listens. Good ideas can originate from many different contributors, even recent entrants into a project. Even though leadership paradigms such as BDFL (Benevolent Dictator for Life) are popular, note the use of the word benevolent.”
Additionally, the course covers the extremely important topic of getting help. This includes how to get help from others and how to access and work with documentation. First, the course considers how to view Linux man pages and then delves into how to use the info utility. Next, it examines how to use the built-in help facilities in many commands. Finally, it offers comprehensive coverage of graphical help interfaces.
Are you unfamiliar with some of these sources of help? The course explains them from the ground up:
manis the workhorse of Linux documentation as it has been on all UNIX-like operating systems since their inception. Its name is short for manual.
Infois a simple-to-use documentation system, hypertextual in nature, although it does not require a graphical browser. The documentation is built using the Texinfo system, which as a reader you need know nothing about.
Whatever Linux distribution you are running, there should be a graphical interface to the online documentation. Exactly how you can invoke it from the menus on your taskbar will vary, but with a little bit of searching, you should find it.
With the groundwork laid for working with open source tools and platforms and comprehensive guidance for getting help, the course then delves into hands-on instruction on topics including working with shells, bash and the command line, and Command Details. We will cover the course’s approach to these important topics in coming installments of this series.
Kubernetes RBAC and serviceaccounts are being used by applications to interact with the cluster.
We are now introducing and using Helm for a deployment (specifically for the deployment of the etcd-operator in part 3)
All versions of the main tools and technologies have been upgraded and locked
Fixed bugs, refactored K8s manifests and refactored applications’ code
We are now providing Dockerfile specs for socat registry and Jenkins
We’ve improved all instructions in the blog post and included a number of informational text boxes
The software industry is rapidly seeing the value of using containers as a way to ease development, deployment, and environment orchestration for app developers. Large-scale and highly-elastic applications that are built in containers definitely have their benefits, but managing the environment can be daunting. This is where an orchestration tool like Kubernetes really shines.
Kubernetes is a platform-agnostic container orchestration tool created by Google and heavily supported by the open source community as a project of the Cloud Native Computing Foundation. It allows you to spin up a number of container instances and manage them for scaling and fault tolerance. It also handles a wide range of management activities that would otherwise require separate solutions or custom code, including request routing, container discovery, health checking, and rolling updates.
Kenzan is a services company that specializes in building applications at scale. We’ve seen cloud technology evolve over the last decade, designing microservice-based applications around the Netflix OSS stack, and more recently implementing projects using the flexibility of container technology. While each implementation is unique, we’ve found the combination of microservices, Kubernetes, and Continuous Delivery pipelines to be very powerful.
Crossword Puzzles, Kubernetes, and CI/CD
This article is the first in a series of four blog posts. Our goal is to show how to set up a fully-containerized application stack in Kubernetes with a simple CI/CD pipeline to manage the deployments.
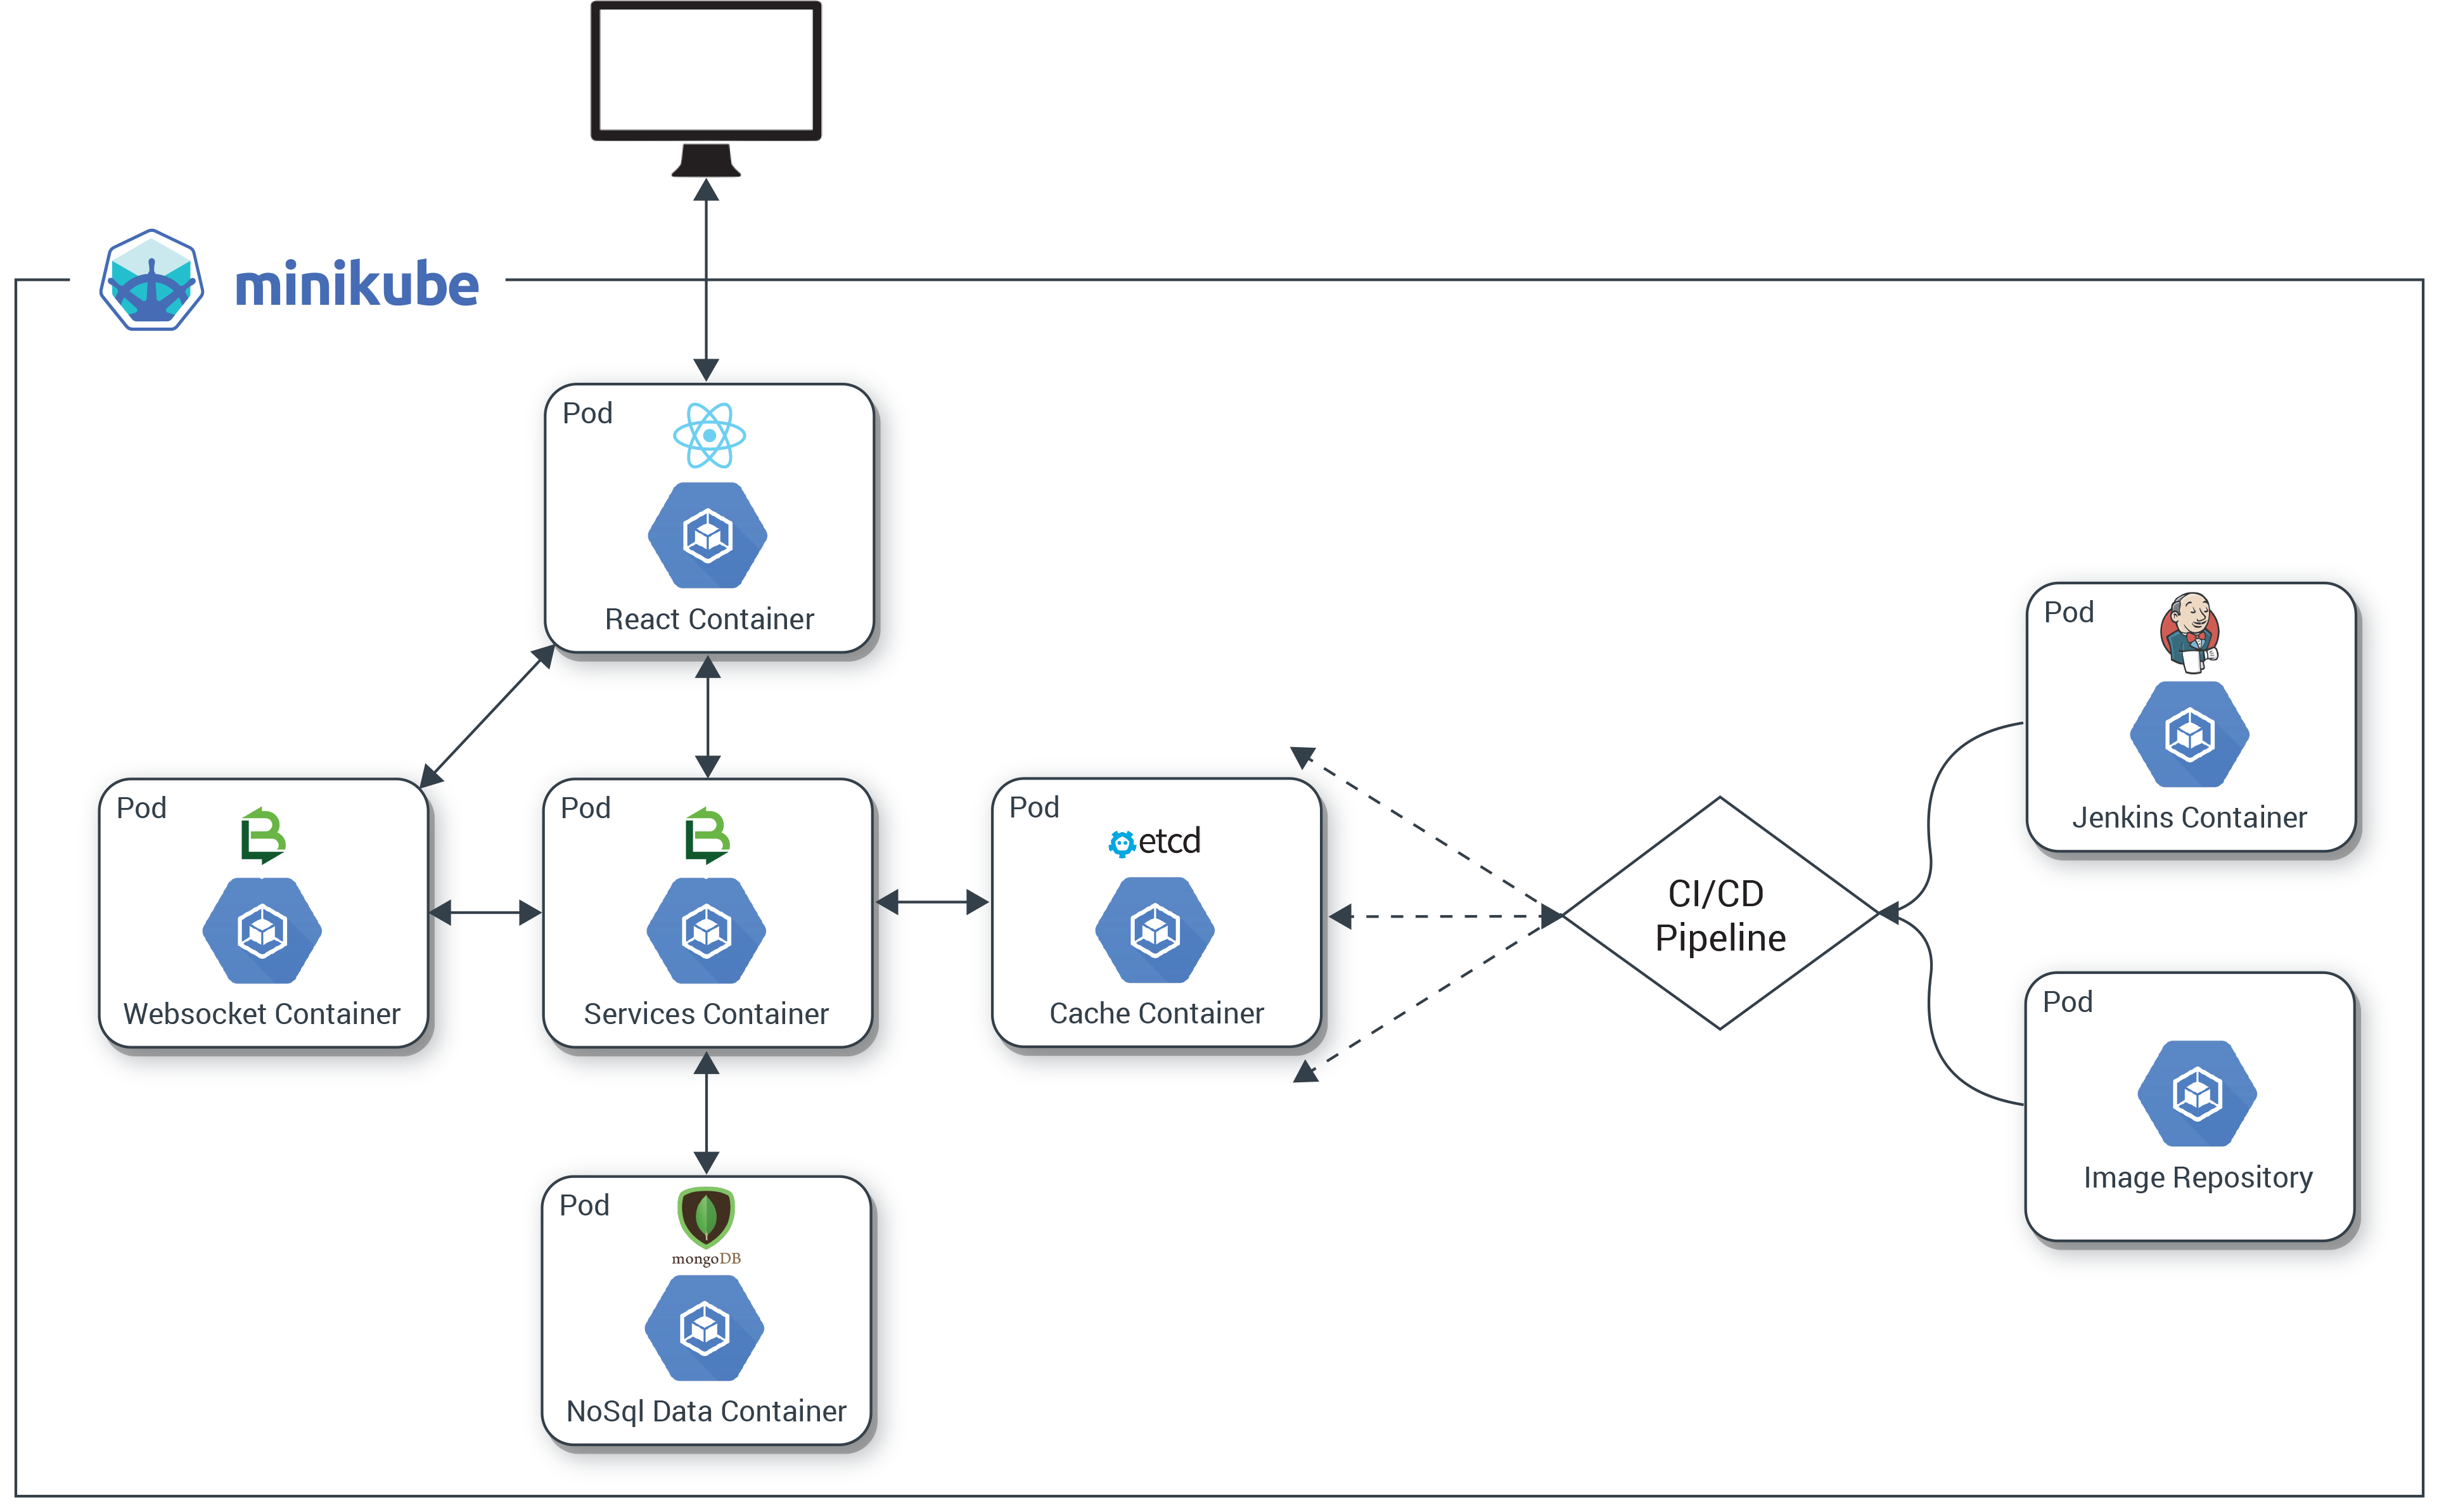
We’ll describe the setup and deployment of an application we created especially for this series. It’s called the Kr8sswordz Puzzle, and working with it will help you link together some key Kubernetes and CI/CD concepts. The application will start simple enough, then as we progress we will introduce components that demonstrate a full application stack, as well as a CI/CD pipeline to help manage that stack, all running as containers on Kubernetes. Check out the architecture diagram below to see what you’ll be building.
The completed application will show the power and ease with which Kubernetes manages both apps and infrastructure, creating a sandbox where you can build, deploy, and spin up many instances under load.
Get Kubernetes up and Running
The first step in building our Kr8sswordz Puzzle application is to set up Kubernetes and get comfortable with running containers in a pod. We’ll install several tools explained along the way: Docker, Minikube, and Kubectl.
This tutorial only runs locally in Minikube and will not work on the cloud. You’ll need a computer running an up-to-date version of Linux or macOS. Optimally, it should have 16 GB of RAM. Minimally, it should have 8 GB of RAM. For best performance, reboot your computer and keep the number of running apps to a minimum.
Install Docker
Docker is one of the most widely used container technologies and works directly with Kubernetes.
Install Docker on Linux
To quickly install Docker on Ubuntu 16.04 or higher, open a terminal and enter the following commands (see the Linux installation instructions for other distributions):
sudo apt-get updatecurl -fsSL https://get.docker.com/ | s
After installation, create a Docker group so you can run Docker commands as a non-root user (you’ll need to log out and then log back in after running this command):
sudo usermod -aG docker $USER
When you’re all done, make sure Docker is running:
sudo service docker start
Install Docker on macOS
Download Docker for Mac (stable) and follow the installation instructions. To launch Docker, double-click the Docker icon in the Applications folder. Once it’s running, you’ll see a whale icon in the menu bar.
Try Some Docker Commands
You can test out Docker by opening a terminal window and entering the following commands:
# Display the Docker versiondocker version# Pull and run the Hello-World image from Docker Hubdocker run hello-world# Pull and run the Busybox image from Docker Hubdocker run busybox echo "hello, you've run busybox"# View a list of containers that have rundocker ps -a
Images are specs that define all the files and resources needed for a container to run. Images are defined in a DockerFile, and built and stored in a repository. Many OSS images are publically available on Docker Hub, a web repository for Docker images. Later we will setup a private image repository for our own images.
Minikube is a single-node Kubernetes cluster that makes it easy to run Kubernetes locally on your computer. We’ll use Minikube as the primary Kubernetes cluster to run our application on. Kubectlis a command line interface (CLI) for Kubernetes and the way we will interface with our cluster. (For details, check out Running Kubernetes Locally via Minikube.)
Install Virtual Box
Download and install the latest version of VirtualBox for your operating system. VirtualBox lets Minikube run a Kubernetes node on a virtual machine (VM)
Install Minikube
Head over to the Minikube releases page and install the latest version of Minikube using the recommended method for your operating system. This will set up our Kubernetes node.
Install Kubectl
The last piece of the puzzle is to install kubectl so we can talk to our Kubernetes node. Use the commands below, or go to the kubectl install page.
On Linux, install kubectl using the following command:
Helm is a package manager for Kubernetes. It allows you to deploy Helm Charts (or packages) onto a K8s cluster with all the resources and dependencies needed for the application. We will use it a bit later in Part 3, and highlight how powerful Helm charts are.
On Linux or macOS, install Helm with the following command.
Now it’s time to make your own copy of the Kubernetes CI/CD repository on Github.
1. Install Git on your computer if you don’t have it already.
On Linux, use the following command:
sudo apt-get install git
On macOS, download and run the macOS installer for Git. To install, first double-click the .dmg file to open the disk image. Right-click the .pkg file and click Open, and then click Open again to start the installation.
2. Fork Kenzan’s Kubernetes CI/CD repository on Github. This has all the containers and other goodies for our Kr8sswordz Puzzle application, and you’ll want to fork it as you’ll later be modifying some of the code.
a. Sign up if you don’t yet have an account on Github.
b. On the Kubernetes CI/CD repository on Github, click the Fork button in the upper right and follow the instructions.
c. Within a chosen directory, clone your newly forked repository.
This command will clear out any other Kubernetes contexts you’ve previously setup on your machine locally, so be careful. If you want to keep your previous contexts, avoid the last command which deletes the ~/.kube folder.
Run a Test Pod
Now we’re ready to test out Minikube by running a Pod based on a public image on Docker Hub.
A Pod is Kubernetes’ resiliency wrapper for containers, allowing you to horizontally scale replicas.
1. Start up the Kubernetes cluster with Minikube, giving it some extra resources.
If your computer does not have 16 GB of RAM, we suggest giving Minikube less RAM in the command above. Set the memory to a minimum of 4 GB rather than 8 GB.
Inspect the pods in the cluster. You should see the add-ons heapster, influxdb-grafana, and nginx-ingress-controller.
kubectl get pods --all-namespaces
3. View the Minikube Dashboard in your default web browser. Minikube Dashboard is a UI for managing deployments. You may have to refresh the web browser if you don’t see the dashboard right away.
minikube service kubernetes-dashboard --namespace kube-system
4. Deploy the public nginx image from DockerHub into a pod. Nginx is an open source web server that will automatically download from Docker Hub if it’s not available locally.
kubectl run nginx --image nginx --port 80
After running the command, you should be able to see nginx under Deployments in the Minikube Dashboard with Heapster graphs. (If you don’t see the graphs, just wait a few minutes.)
A Kubernetes Deployment is a declarative way of creating, maintaining and updating a specific set of Pods or objects. It defines an ideal state so K8s knows how to manage the Pods.
5. Create a K8s service for deployment. This will expose the nginx pod so you can access it with a web browser.
6. The following command will launch a web browser to test the service. The nginx welcome page displays, which means the service is up and running. Nice work!
minikube service nginx
7. Delete the nginx deployment and service you created.
kubectl delete service nginxkubectl delete deployment nginx
Create a Local Image Registry
We previously ran a public image from Docker Hub. While Docker Hub is great for public images, setting up a private image repository on the site involves some security key overhead that we don’t want to deal with. Instead, we’ll set up our own local image registry. We’ll then build, push, and run a sample Hello-Kenzan app from the local registry. (Later, we’ll use the registry to store the container images for our Kr8sswordz Puzzle app.
8. From the root directory of the cloned repository, set up the cluster registry by applying a .yaml manifest file.
kubectl apply -f manifests/registry.yaml
Manifest .yaml files (also called k8s files) serve as a way of defining objects such as Pods or Deployments in Kubernetes. While previously we used the run command to launch a pod, here we are applying k8s files to deploy pods into Kubernetes.
9. Wait for the registry to finish deploying using the following command. Note that this may take several minutes.
kubectl rollout status deployments/registry
10. View the registry user interface in a web browser. Right now it’s empty, but you’re about to change that.
minikube service registry-ui
11. Let’s make a change to an HTML file in the cloned project. Open the /applications/hello-kenzan/index.html file in your favorite text editor, or run the command below to open it in the nano text editor.
nano applications/hello-kenzan/index.html
Change some text inside one of the <p> tags. For example, change “Hello from Kenzan!” to “Hello from Me!”. When you’re done, save the file. (In nano, press Ctrl+X to close the file, type Y to confirm the filename, and press Enter to write the changes to the file.)
12. Now let’s build an image, giving it a special name that points to our local cluster registry.
When a docker image is tagged with a hostname prefix (as shown above), Docker will perform pull and push actions against a private registry located at the hostname as opposed to the default Docker Hub registry.
13. We’ve built the image, but before we can push it to the registry, we need to set up a temporary proxy. By default the Docker client can only push to HTTP (not HTTPS) via localhost. To work around this, we’ll set up a Docker container that listens on 127.0.0.1:30400 and forwards to our cluster.
14. Now run the proxy container from the newly created image. (Note that you may see some errors; this is normal as the commands are first making sure there are no previous instances running.)
This step will fail if local port 30400 is currently in use by another process. You can check if there’s any process currently using this port by running the command lsof -i :30400
15. With our proxy container up and running, we can now push our hello-kenzan image to the local repository.
docker push 127.0.0.1:30400/hello-kenzan:latest
Refresh the browser window with the registry UI and you’ll see the image has appeared.
16. The proxy’s work is done for now, so you can go ahead and stop it.
docker stop socat-registry
17. With the image in our cluster registry, the last thing to do is apply the manifest to create and deploy the hello-kenzan pod based on the image.
Notice the change you made to the index.html file. That change was baked into the image when you built it and then was pushed to the registry. Pretty cool!
19. Delete the hello-kenzan deployment and service you created.
kubectl delete service hello-kenzankubectl delete deployment hello-kenzan
We are going to keep the registry deployment in our cluster as we will need it for the next few parts in our series.
If you’re done working in Minikube for now, you can go ahead and stop the cluster by entering the following command:
minikube stop
If you need to walk through the steps we did again (or do so quickly), we’ve provided npm scripts that will automate running the same commands in a terminal.
1. To use the automated scripts, you’ll need to install NodeJS and npm.
On Linux, follow the NodeJS installation steps for your distribution. To quickly install NodeJS and npm on Ubuntu 16.04 or higher, use the following terminal commands.
a. curl -sL https://deb.nodesource.com/setup_7.x | sudo -E bash -
2. Change directories to the cloned repository and install the interactive tutorial script:
 a. cd ~/kubernetes-ci-cd

 b. npm install
3. Start the script
npm run part1 (or part2, part3, part4 of the blog series)
4. PressEnterto proceed running each command.
Up Next
In Part 2of the series, we will continue to build out our infrastructure by adding in a CI/CD component: Jenkins running in its own pod. Using a Jenkins 2.0 Pipeline script, we will build, push, and deploy our Hello-Kenzan app, giving us the infrastructure for continuous deployment that will later be used with our Kr8sswordz Puzzle app.
This article was revised and updated by David Zuluaga, a front end developer at Kenzan. He was born and raised in Colombia, where he studied his BE in Systems Engineering. After moving to the United States, he studied received his master’s degree in computer science at Maharishi University of Management. David has been working at Kenzan for four years, dynamically moving throughout a wide range of areas of technology, from front-end and back-end development to platform and cloud computing. David’s also helped design and deliver training sessions on Microservices for multiple client teams.
Every byte of a TLS connection explained and reproduced.
In this demonstration, a client has connection to a server, negotiated a TLS 1.2 session, sent “ping”, received “pong”, and then terminated the session. Click below to begin exploring.
Client Hello
The session begins with the client saying “Hello”. The client provides the following:
After months of user testing in developer and beta channels, the Crostini project at Google finally delivered the goods, Linux apps for most users of Chromebooks in the stable channeldefinitely worth the wait. While this still is aimed primarily at developers using Chromebooks, I think there’s a good chance these Linux apps will be used and enjoyed by the general public using Chromebooks as well. There’s still a bit of a learning curve to overcome before that possibility is realized, but if you already are a user of any Linux distro, it will feel very familiar. Here’s an overview of how to install it and what to expect afterward.
After getting the update to version 69, go to Settings and scroll down a bit, and you’ll see the option to turn on Linux apps. Figure 1 shows this first step. Note that this isn’t available on all Chromebooks; if you’re using an older one, you’ll have to wait a while before this function is available. If you don’t see the option to turn on Linux apps, your Chromebook currently lacks that functionality. But, if you have a Chromebook produced in the past two years, you probably will see the option.
The highly popular PHP 5.x branch will stop receiving security updates at the end of the year.
According to statistics from W3Techs, roughly 78.9 percent of all Internet sites today run on PHP. But on December 31, 2018, security support for PHP 5.6.x will officially cease, marking the end of all support for any version of the ancient PHP 5.x branch.
This means that starting with next year, around 62 percent of all Internet sites still running a PHP 5.x version will stop receiving security updates for their server and website’s underlying technology, exposing hundreds of millions of websites, if not more, to serious security risks.
Linux. It’s powerful, flexible, stable, secure, user-friendly… the list goes on and on. There are so many reasons why people have adopted the open source operating system. One of those reasons which particularly stands out is its flexibility. Linux can be and do almost anything. In fact, it will (in most cases) go well above what most platforms can. Just ask any enterprise business why they use Linux and open source.
But once you’ve deployed those servers and desktops, you need to be able to keep track of them. What’s going on? How are they performing? Is something afoot? In other words, you need to be able to monitor your Linux machines. “How?” you ask. That’s a great question, and one with many answers. I want to introduce you to a few such tools—from command line, to GUI, to full-blown web interfaces (with plenty of bells and whistles). From this collection of tools, you can gather just about any kind of information you need. I will stick only with tools that are open source, which will exempt some high-quality, proprietary solutions. But it’s always best to start with open source, and, chances are, you’ll find everything you need to monitor your desktops and servers. So, let’s take a look at four such tools.
Top
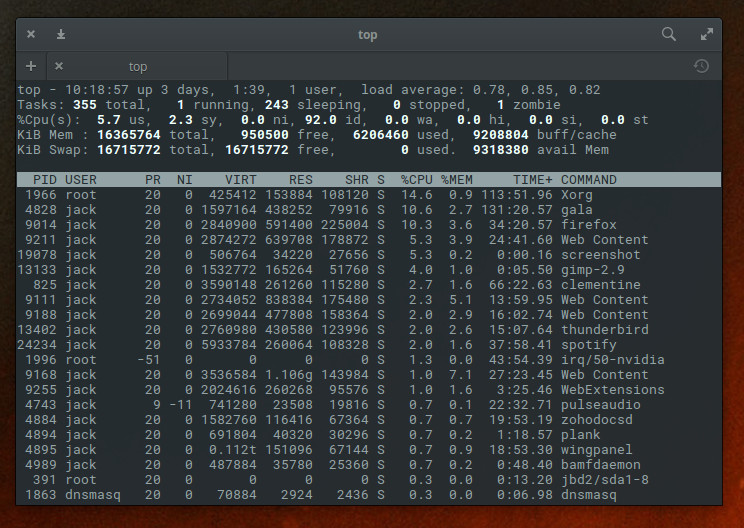
We’ll first start with the obvious. Thetopcommand is a great place to start, when you need to monitor what processes are consuming resources. The top command has been around for a very long time and has, for years, been the first tool I turn to when something is amiss. What top does is provide a real-time view of all running systems on a Linux machine. Thetopcommand not only displays dynamic information about each running process (as well as the necessary information to manage those processes), but also gives you an overview of the machine (such as, how many CPUs are found, and how much RAM and swap space is available). When I feel something is going wrong with a machine, I immediately turn to top to see what processes are gobbling up the most CPU and MEM (Figure 1). From there, I can act accordingly.
Figure 1: Top running on Elementary OS.
There is no need to install anything to use thetop command, because it is installed on almost every Linux distribution by default. For more information on top, issue the command man top.
Glances
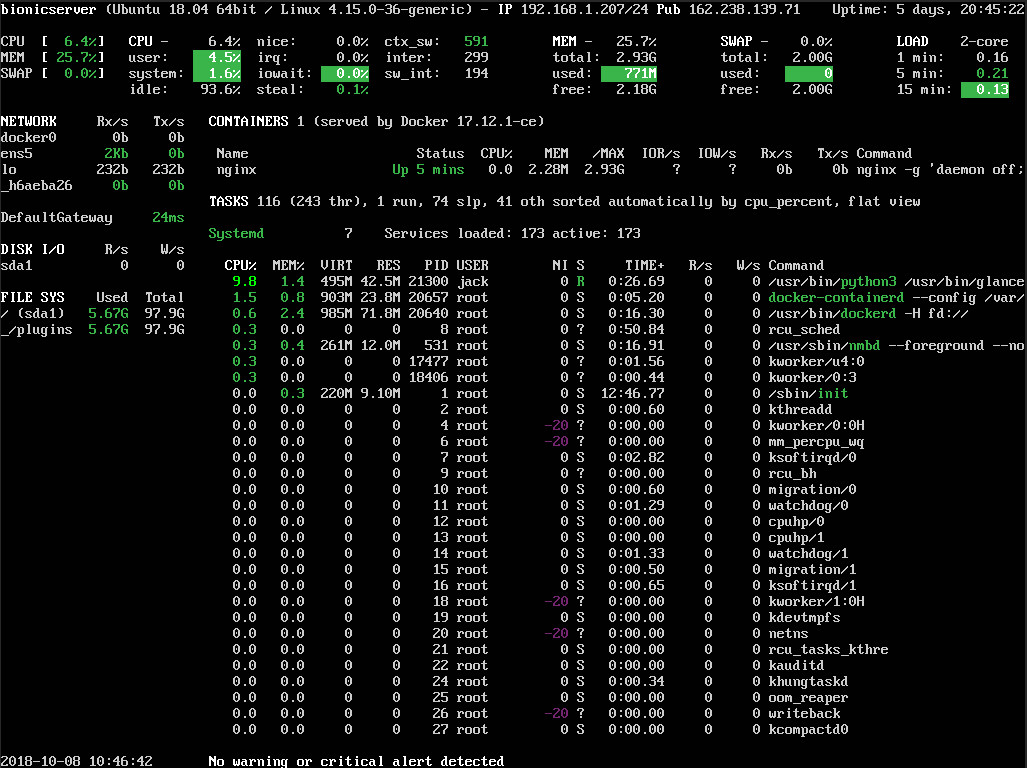
If you thought thetopcommand offered up plenty of information, you’ve yet to experience Glances. Glances is another text-based monitoring tool. In similar fashion to top, glances offers a real-time listing of more information about your system than nearly any other monitor of its kind. You’ll see disk/network I/O, thermal readouts, fan speeds, disk usage by hardware device and logical volume, processes, warnings, alerts, and much more. Glances also includes a handy sidebar that displays information about disk, filesystem, network, sensors, and even Docker stats. To enable the sidebar, hit the 2 key (while glances is running). You’ll then see the added information (Figure 2).
Figure 2: The glances monitor displaying docker stats along with all the other information it offers.
You won’t find glances installed by default. However, the tool is available in most standard repositories, so it can be installed from the command line or your distribution’s app store, without having to add a third-party repository.
GNOME System Monitor
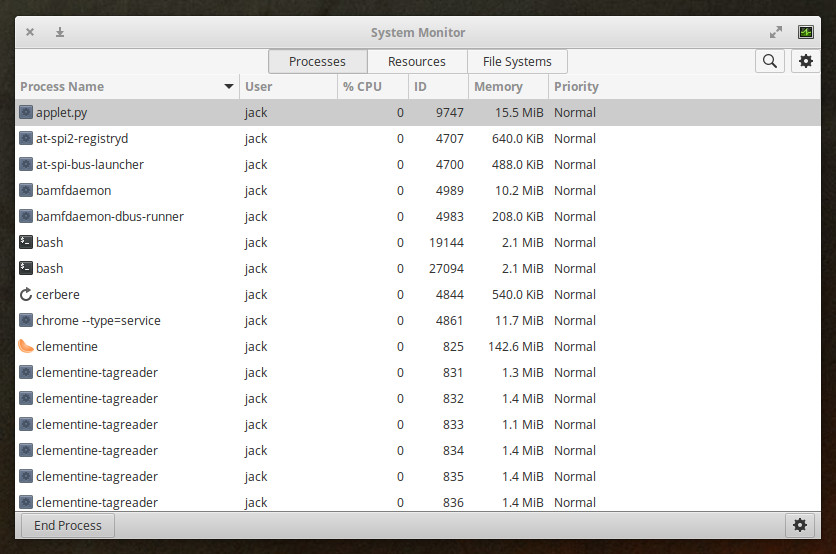
If you’re not a fan of the command line, there are plenty of tools to make your monitoring life a bit easier. One such tool is GNOME System Monitor, which is a front-end for the top tool. But if you prefer a GUI, you can’t beat this app.
With GNOME System Monitor, you can scroll through the listing of running apps (Figure 3), select an app, and then either end the process (by clicking End Process) or view more details about said process (by clicking the gear icon).
Figure 3: GNOME System Monitor in action.
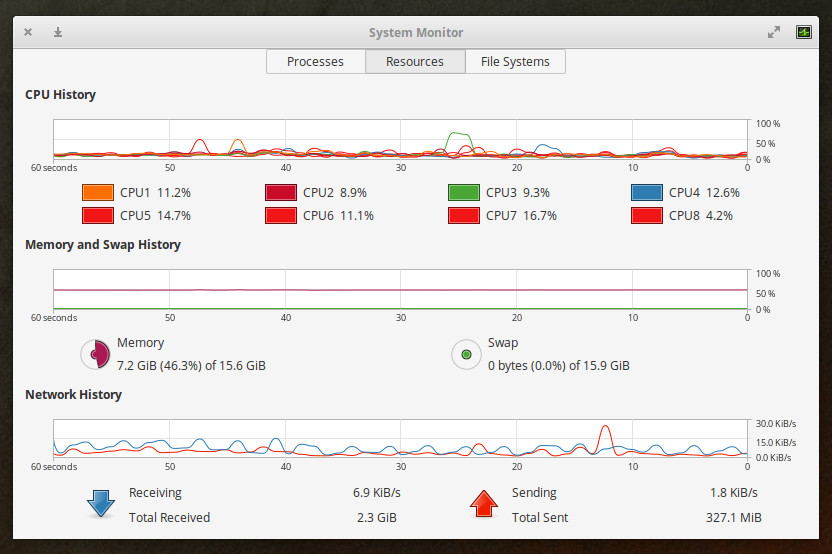
You can also click any one of the tabs at the top of the window to get even more information about your system. The Resources tab is a very handy way to get real-time data on CPU, Memory, Swap, and Network (Figure 4).
Figure 4: The GNOME System Monitor Resources tab in action.
If you don’t find GNOME System Monitor installed by default, it can be found in the standard repositories, so it’s very simple to add to your system.
Nagios
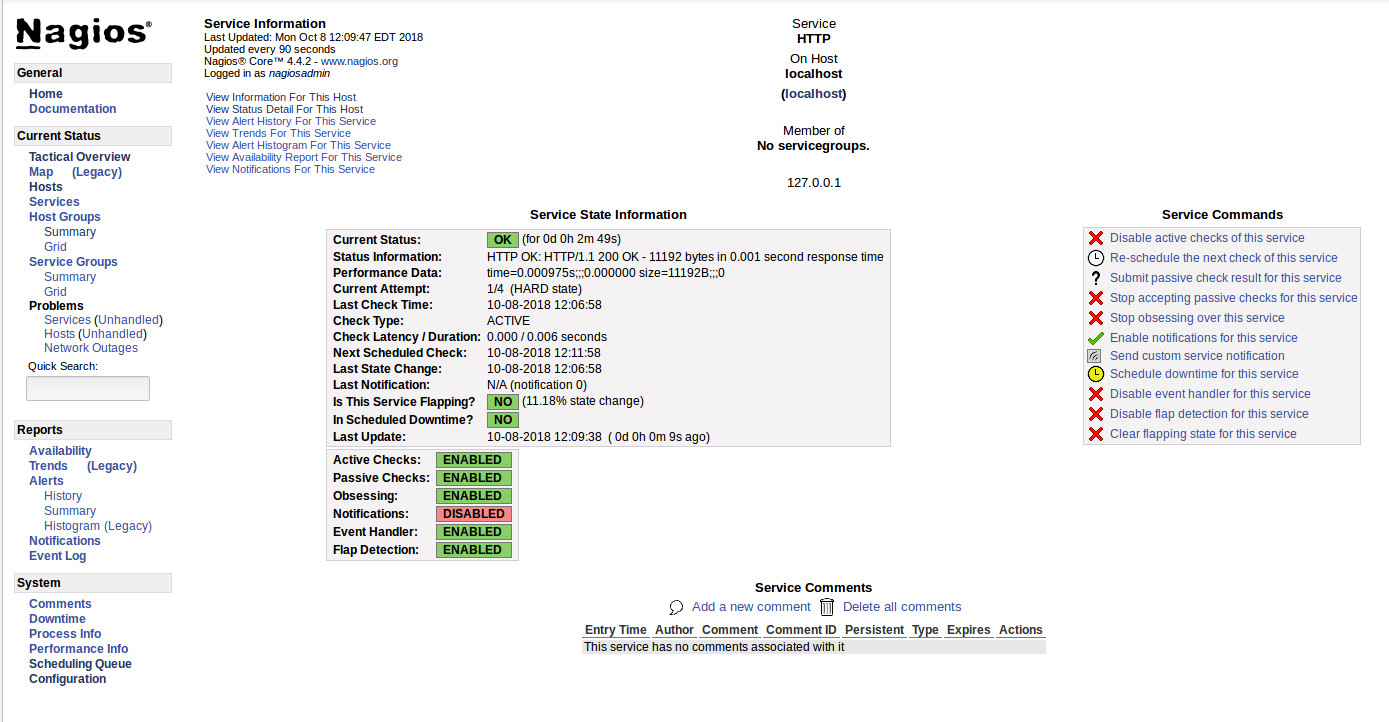
If you’re looking for an enterprise-grade networking monitoring system, look no further than Nagios. But don’t think Nagios is limited to only monitoring network traffic. This system has over 5,000 different add-ons that can be added to expand the system to perfectly meet (and exceed your needs). The Nagios monitor doesn’t come pre-installed on your Linux distribution and although the install isn’t quite as difficult as some similar tools, it does have some complications. And, because the Nagios version found in many of the default repositories is out of date, you’ll definitely want to install from source. Once installed, you can log into the Nagios web GUI and start monitoring (Figure 5).
Figure 5: With Nagios you can even start and stop services.
Of course, at this point, you’ve only installed the core and will also need to walk through the process of installing the plugins. Trust me when I say it’s worth the extra time. The one caveat with Nagios is that you must manually install any remote hosts to be monitored (outside of the host the system is installed on) via text files. Fortunately, the installation will include sample configuration files (found in /usr/local/nagios/etc/objects) which you can use to create configuration files for remote servers (which are placed in /usr/local/nagios/etc/servers).
Although Nagios can be a challenge to install, it is very much worth the time, as you will wind up with an enterprise-ready monitoring system capable of handling nearly anything you throw at it.
There’s More Where That Came From
We’ve barely scratched the surface in terms of monitoring tools that are available for the Linux platform. No matter whether you’re looking for a general system monitor or something very specific, a command line or GUI application, you’ll find what you need. These four tools offer an outstanding starting point for any Linux administrator. Give them a try and see if you don’t find exactly the information you need.
Learn more about Linux through the free “Introduction to Linux” course from The Linux Foundation and edX.
Practical techniques to ensure developers can actually do the things you want them to do using your API.
In the previous chapters, we gave an overview of various approaches for transmitting data via your web API. Now that you’re familiar with the landscape of transport and have an understanding of how to choose between various patterns and frameworks, we want to provide some tactical best practices to help your developers get the most out of your API.
Designing for Real-Life Use Cases
When designing an API, it’s best to make decisions that are grounded in specific, real-life use cases. Let’s dig into this idea a bit more. Think about the developers who are using your API. What tasks should they be able to complete with your API? What types of apps should developers be able to build? For some companies, this is as targeted as “developers should be able to charge customer credit cards.” For other companies, the answer can be more open-ended: “developers should be able to create a full suite of interactive consumer-quality applications.”
Test automation tools are not used very often. Only 16 percent of performance test cases are executed with test automation tools, and security tests are being completed at the same frequency according to the World Quality Report (WQR) 2018-2019, which surveyed 1,700 IT decision makers (ITDMs) at companies with more than a thousand employees. Although the QA and testing job roles have been adapting to agile development practices, remember that even if one test is automated, the majority of tests are still done manually.
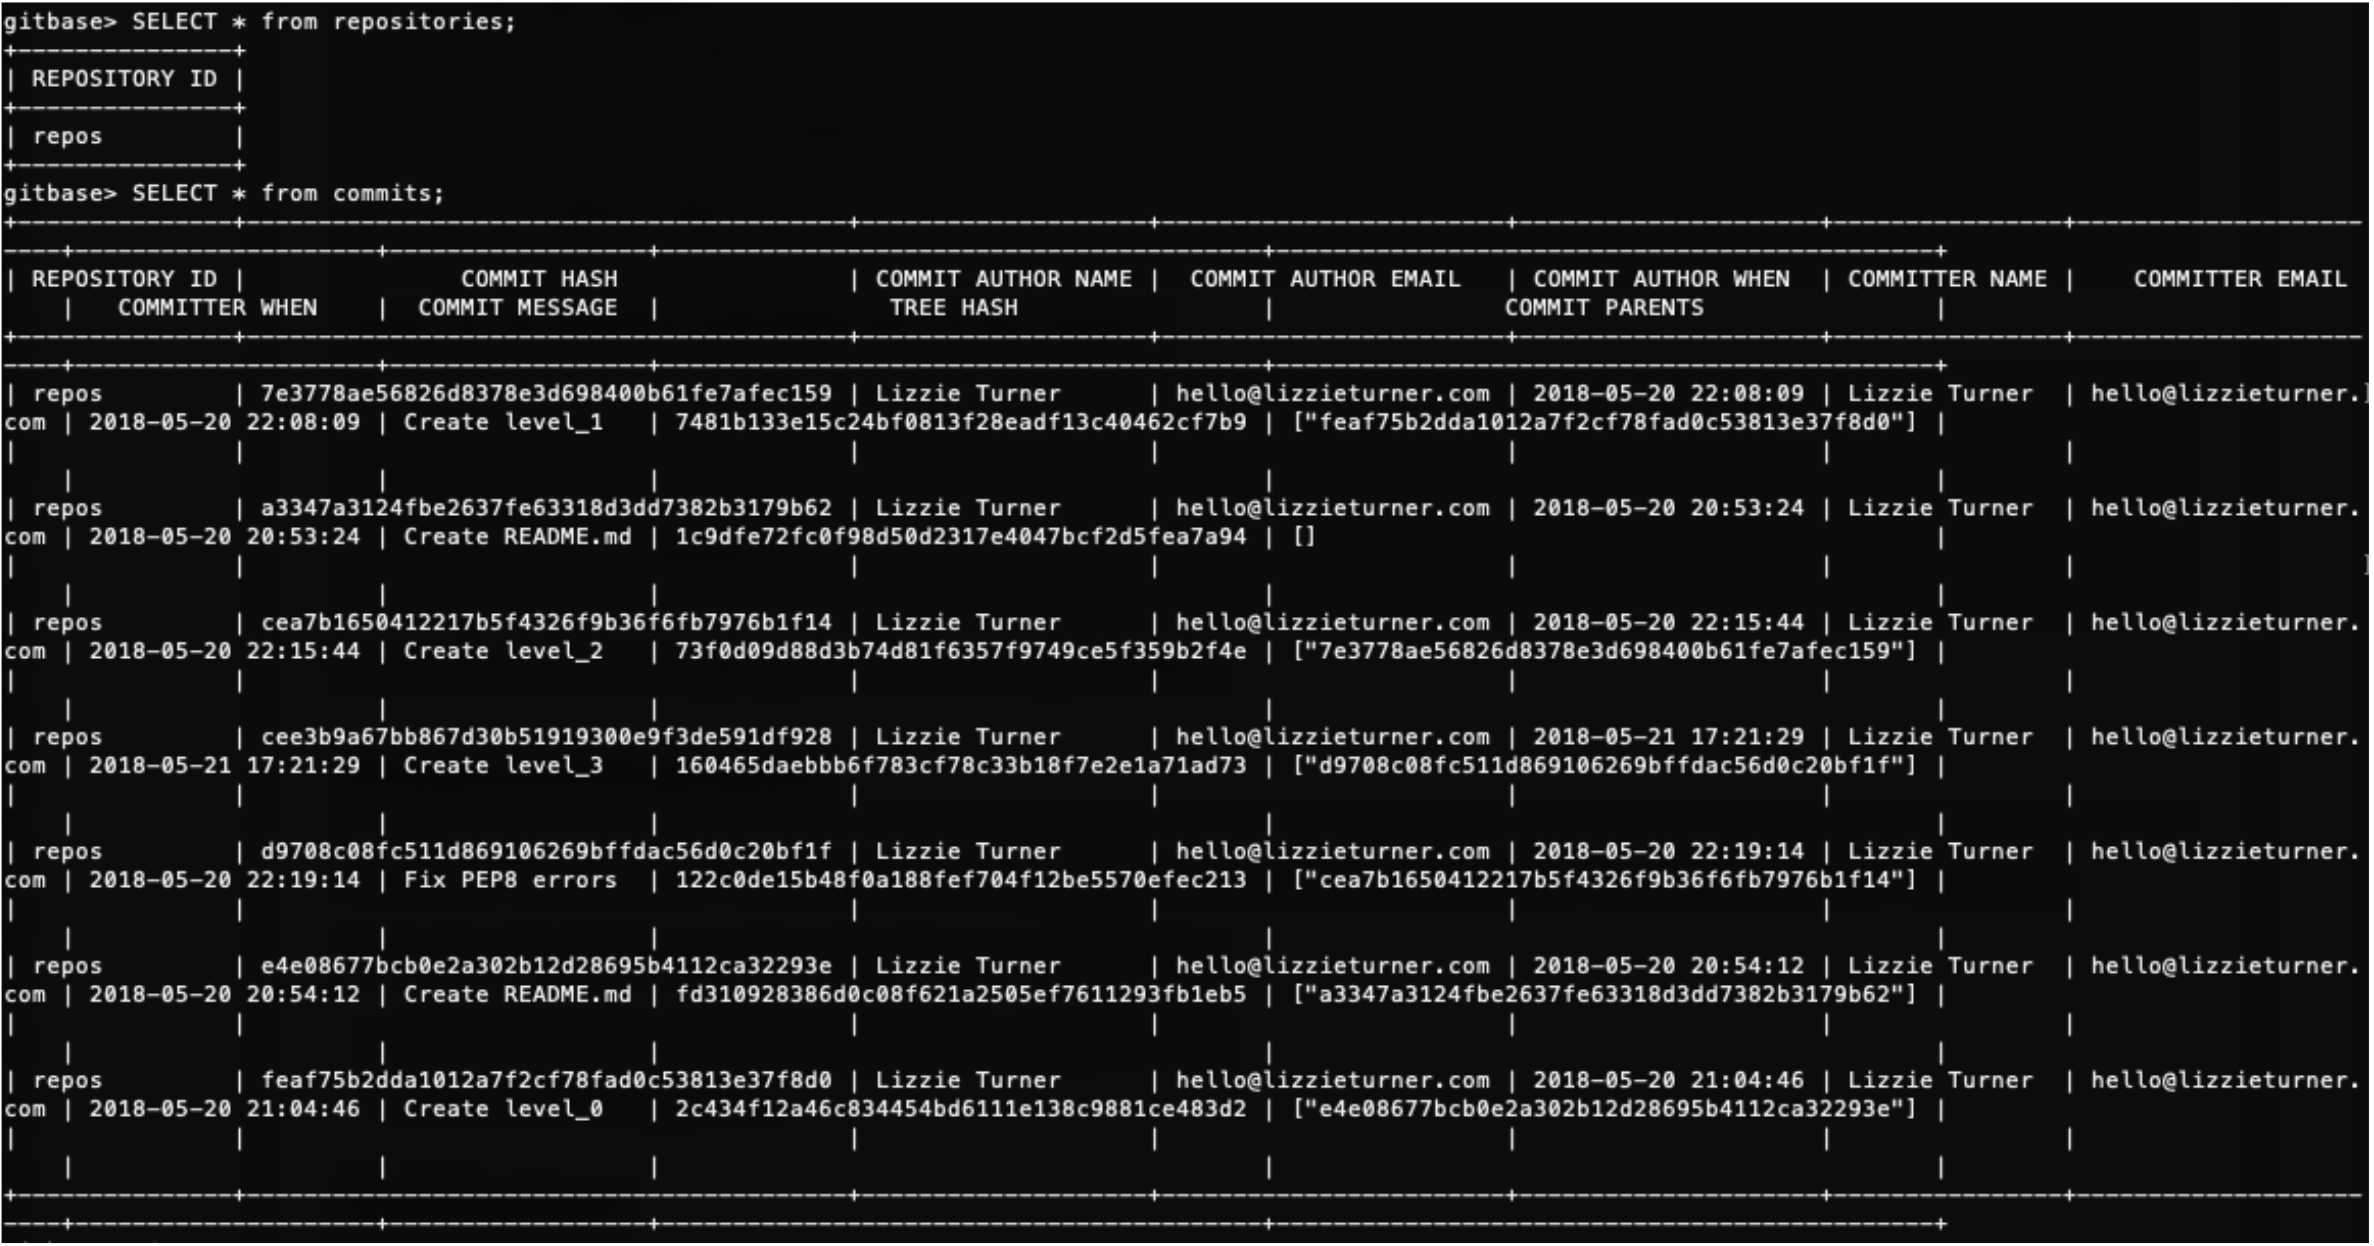
With the recent advances in machine learning technology, it is only a matter of time before developers can expect to run full diagnostics and information retrieval on their own source code. This can include autocompletion, auto-generated user tests, more robust linters, automated code reviews and more. I recently reviewed a new product in this sphere — the source{d} Engine. source{d} offers a suite of applications that uses machine learning on code to complete source code analysis and assisted code reviews. Chief among them is the source{d} Engine, now in public beta; it uses a suite of open source tools (such as Gitbase, Babelfish, and Enry) to enable large-scale source code analysis. Some key uses of the source{d} Engine include language identification, parsing code into abstract syntax trees, and performing SQL Queries on your source code such as:
What are the top repositories in a codebase based on number of commits?
What is the most recent commit message in a given repository?
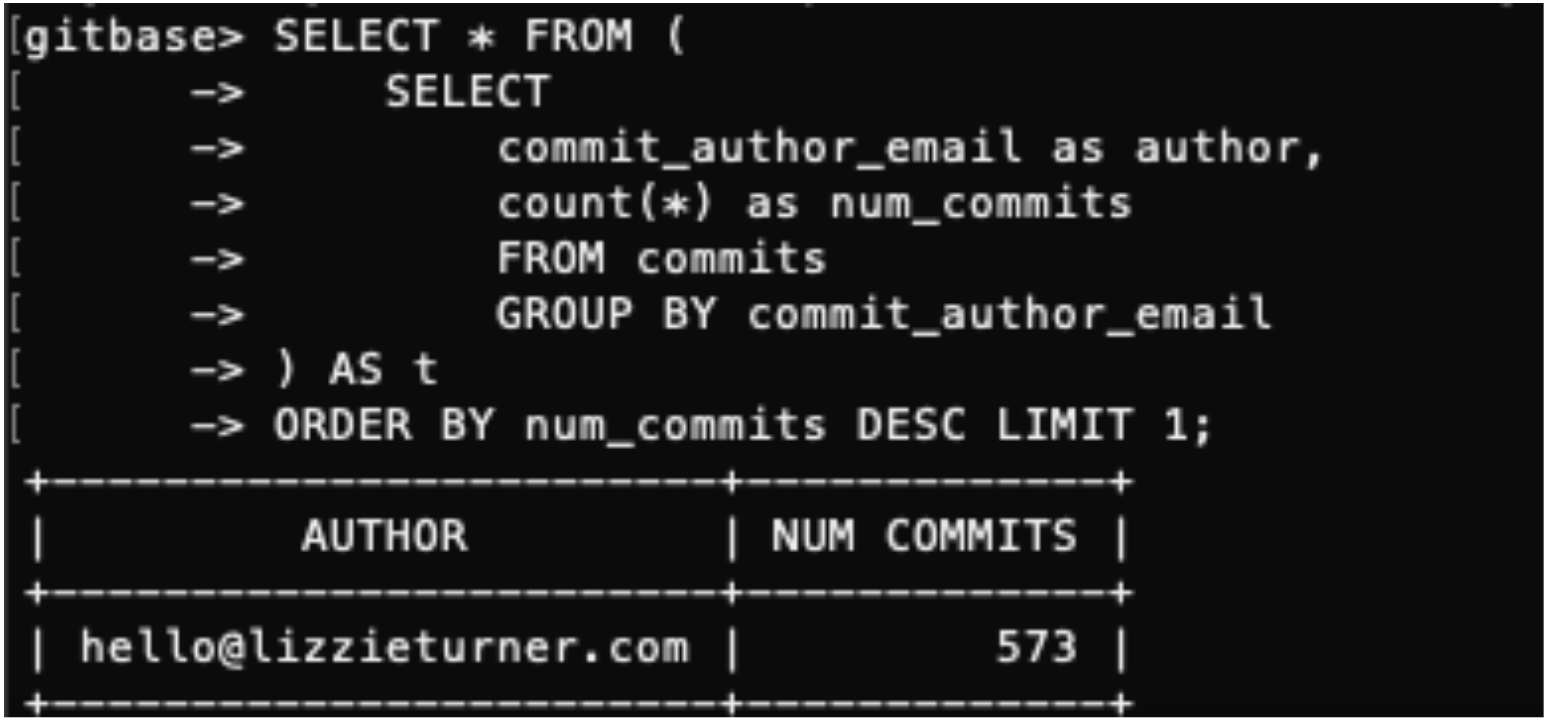
Who are the most prolific contributors in a repository?
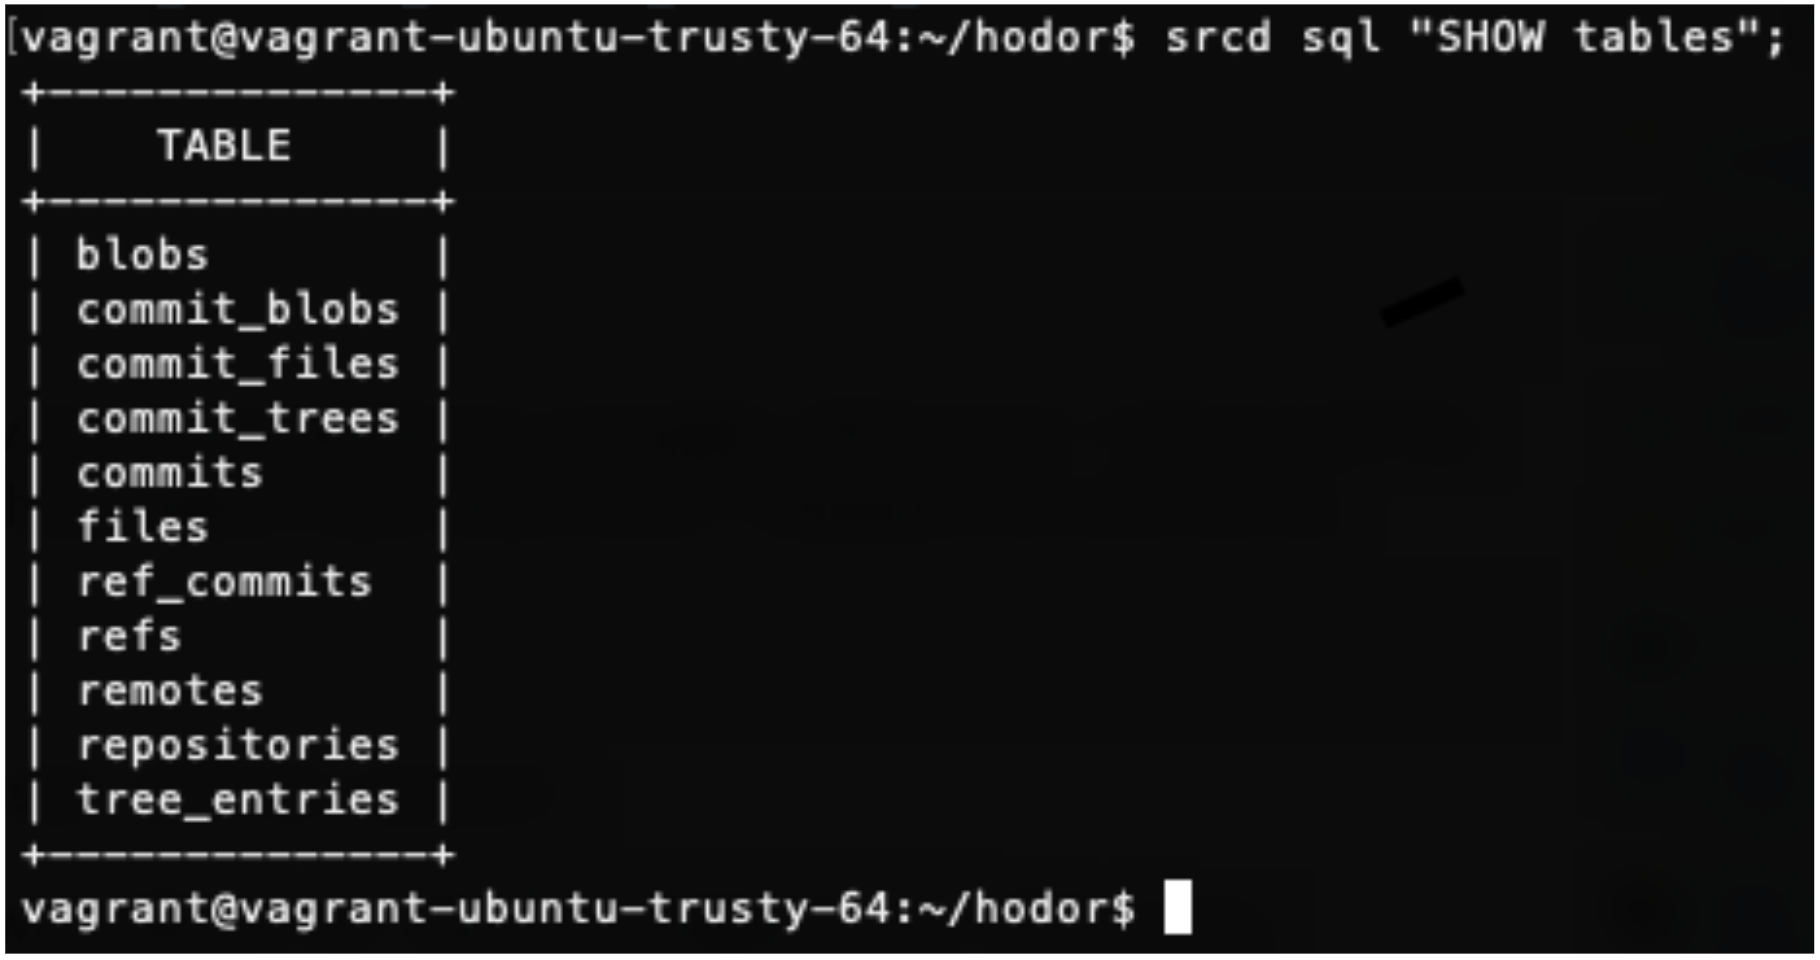
Because source{d} Engine uses both agnostic language analysis and standard SQL queries, the information available feels infinite.
Figure 1: Basic database structure.
From minute one, using source{d} Engine was an easy, efficient process. I ran source{d} Engine chiefly on a virtual machine running Ubuntu 14.04 but also installed it on MacOS and Ubuntu 16.04 for comparison purposes. On all three, install was completely painless, although the Ubuntu versions seemed to run slightly faster. The source{d} Engine documentation is accurate and thorough. It correctly warned me that the first time initializing the engine would take a fair amount of time so I was prepared for the wait. I did have to debug a few errors, all relating to my having a previous SQL instance running so some more thorough troubleshooting documentation might be warranted.
Figure 2: Listing the top contributor of a given repository.
It’s simple to go between codebases using the commands scrd kill and scrd init. I wanted to explore many use cases so I picked a wide variety of codebases to test on ranging from a single contributor with only 5 commits to one with 10 contributors, thousands of lines of code, and hundreds of commits. source{d} Engine worked phenomenally with all of them although it is easier to see the benefits in a larger codebase.
Figure 3: Listing all commits from a repository — not so easy in a bigger codebase, but fantastic when there are only eight!
My favorite queries to run were those pertaining to commits. I am not a fan of the way GitHub organizes commit history, so I find myself coming back to source{d} Engine again and again when I want commit history-related information. I’m also very impressed with the Universal Abstract Syntax Tree (UAST) concept. A UAST is a normalized form of an abstract syntax tree (AST) — a structural representation of source code used for code analysis. Unlike ASTs, UASTs are language agnostic and do not rely on any specific programming language. The UAST format enables further analysis and can be used with any tools in a standard, open style.
My only complaint is the (obvious and understandable) reliance on a base level of SQL knowledge. Because I was already very familiar with SQL, I was able to quickly use the source{d} Engine engine and create my own queries. However, if I had been shakier on the basics, I would’ve appreciated more example queries. Another minor complaint is that support for Python appears to only be for Python 2 right now, and not Python 3.
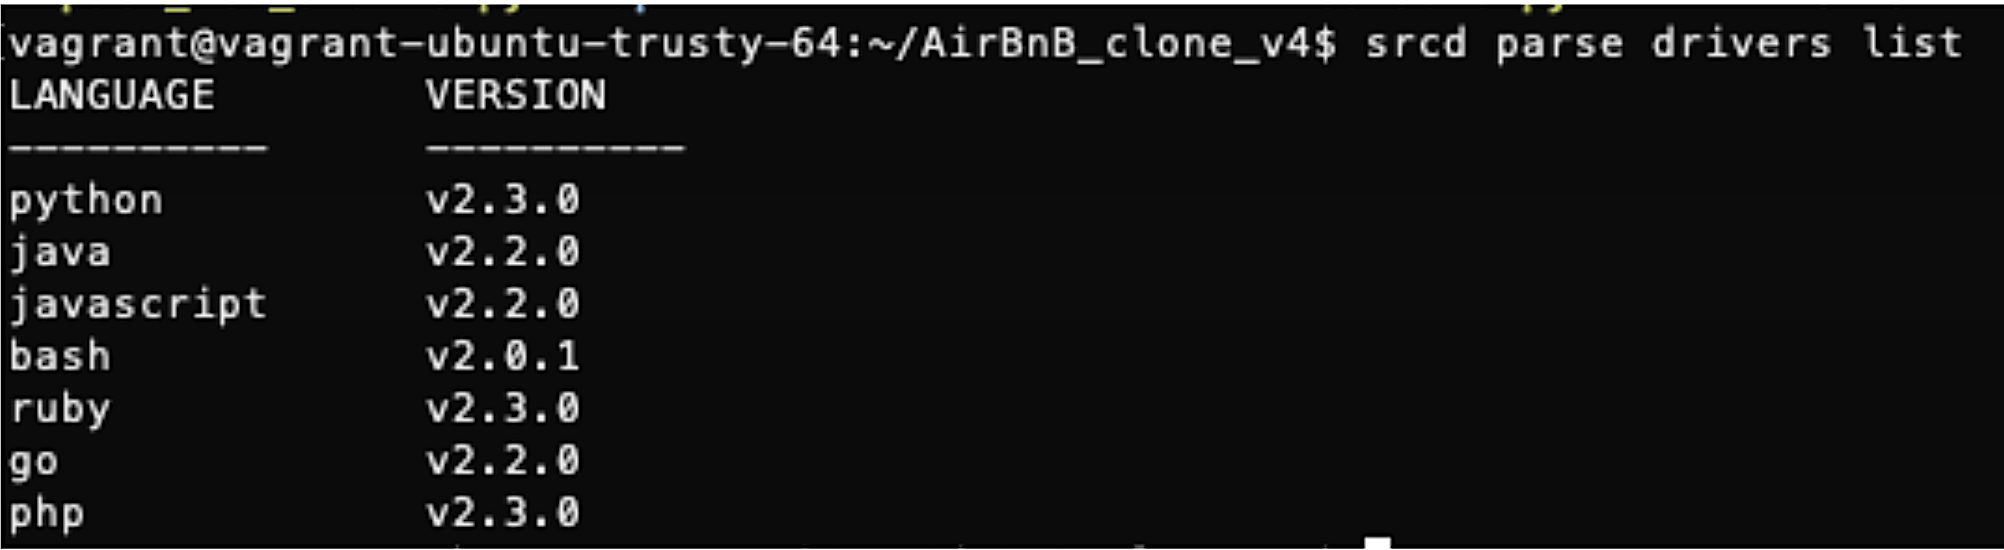
Figure 4: Currently supported drivers.
I’m excited to follow the future of source{d} Engine and also source{d} Lookout (now in public alpha) which is the first step to a suite of true machine learning on code applications. I would love for the documentation of this and other upcoming applications to be more comprehensive, but because they are not fully available yet, just having what’s available already is great.
In general, I’m extremely impressed with the transparency of the company — not only are the future products and applications clearly listed and described, many internal company documents are also available. This true dedication to open source software is amazing, and I hope more companies follow source{d} ’s lead.
Lizzie Turner is a former digital marketing analyst studying full stack software engineering at Holberton School. She is currently looking for her first software engineering role and is particularly passionate about data and analytics. You can find Lizzie on LinkedIn, GitHub, and Twitter.
This article was produced in partnership with Holberton School
The Linux kernel config/build system, also known as Kconfig/kbuild, has been around for a long time, ever since the Linux kernel code migrated to Git. As supporting infrastructure, however, it is seldom in the spotlight; even kernel developers who use it in their daily work never really think about it.
To explore how the Linux kernel is compiled, this article will dive into the Kconfig/kbuild internal process, explain how the .config file and the vmlinux/bzImage files are produced, and introduce a smart trick for dependency tracking.
Kconfig
The first step in building a kernel is always configuration. Kconfig helps make the Linux kernel highly modular and customizable. Kconfig offers the user many config targets: